|
Customer: |
DSL Integrated Solution Pte Ltd |
|
Job Number: |
SG-230002 |
|
|
|
|
Date: |
20.06.2024 |
|
Location: |
Public Utilities Board (KWRP) |
|
Handler: |
Kamarul Effendi |
|
|
10 Kranji Road, Singapore 739520 |
|
|
|
|
|
|
|
|
|
|
|||
|
Final Report
|
|||
|
Blower Performance Evaluation
|
|||
|
|
|||
|
|
|||
|
|
|||
|
|
|||
|
|
|||
|
|
|||
|
|
|||
|
|
|||
|
|
|||
|
|
|||
|
|
|||
|
|
|||
|
|
|||

Objectives & Scope
Neuros Asia Pacific Pte Ltd, was engaged by DSL Integrated Solution Pte Ltd to carry out Blower Performance Studies at Kranji Water Reclamation Plant, 10 Kranji Rd, Singapore 739520.
The Works were carried out on Neuros Turbo Blowers installed at Phase 1 & 2 (Old Power House) and Phase 3 (Main Treatment Module).
Scope of work:
General inspection of Blower Parts, especially discharge check valves in powered down state
Installation of Testing Pipe Spool (Suction and Discharge) fitted with Flow and Pressure measuring instruments (by DSL Integrated Solution)
Setup of Measurement Panel containing datalogger and Hookup with Flow transmitters
Collection of trending discharge and suction flowrate, recorded into ABB datalogger during runtime
Monitoring of essential parameters such as pressure as well as temperature at discharge and suction testing pipes.
Analysis of data and calculation of blower wire to air efficiency in manual operating condition
Report and recommendation
All works were performed during the period 15 Nov 2023 to 12 Jun 2024.
Abstract
To determine the overall blower Wire-to-Air
Efficiency ( , a determination of
the discharge pressure (P), target discharge flowrate (Q) and actual electrical
power consumption (E) will have to be undertaken for every blower. The
following formulae expresses the relationship between the Wire to Air
Efficiency and the aforementioned operating readings:

Where:
P = Discharge pressure (in N/m2, converted from barg)
Q = Target Discharge Flowrate (in Normal m3/s)
E = Electrical power consumption (in kW)
 = Wire to Air
Efficiency
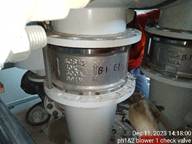
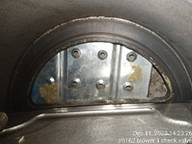
Prior to acquisition of aforementioned data, an inspection on the blower s internal chamber were done, including inspection done on the check valves, for any adverse or abnormal condition of any internal blower parts.
Inspection of Check Valves
|
While handling the electrical & electronic devices, Neuros personnel followed OEM standard, Safe work procedures and Practice ESD avoidance. Ensuring customer s equipment are well maintained and safe for operation.
|
||
|
|
|
|
|
|
|
|
|
|
|
|
|
|
|
|
|
|
|
|
|
|
|
|
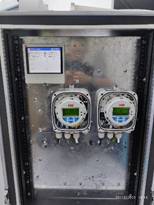
Installation of Measurement Panel, Flow Transmitters and Datalogger
|
Measurement Panel for Flowmeters and Dataloggers
|
||
|
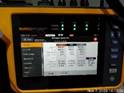
Pressure Gauges & Power Quality Analyzer
|
|
|
|
|
|
|
|
|
|
|
|
|
|
|
|
|
|
|
|
|
|
|
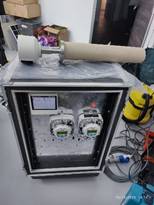
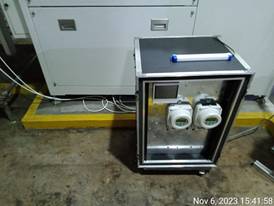
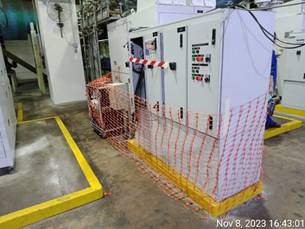
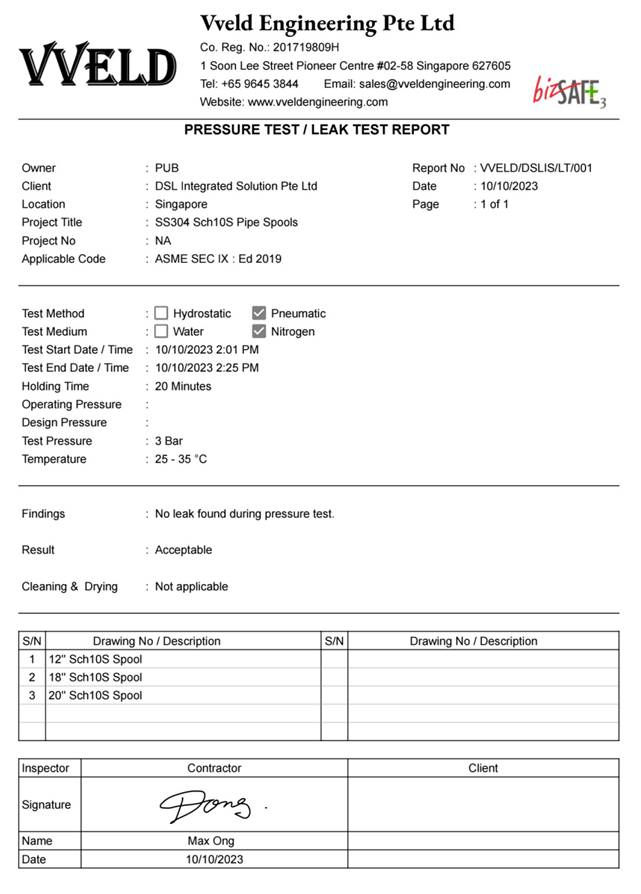
Prior to installation of testing pipes, the pipes were NDT-Tested using Dye Penetrant Test on all weld joints and subjected to pneumatic leak test at 3 bars using Nitrogen gas to ensure its mechanical integrity.
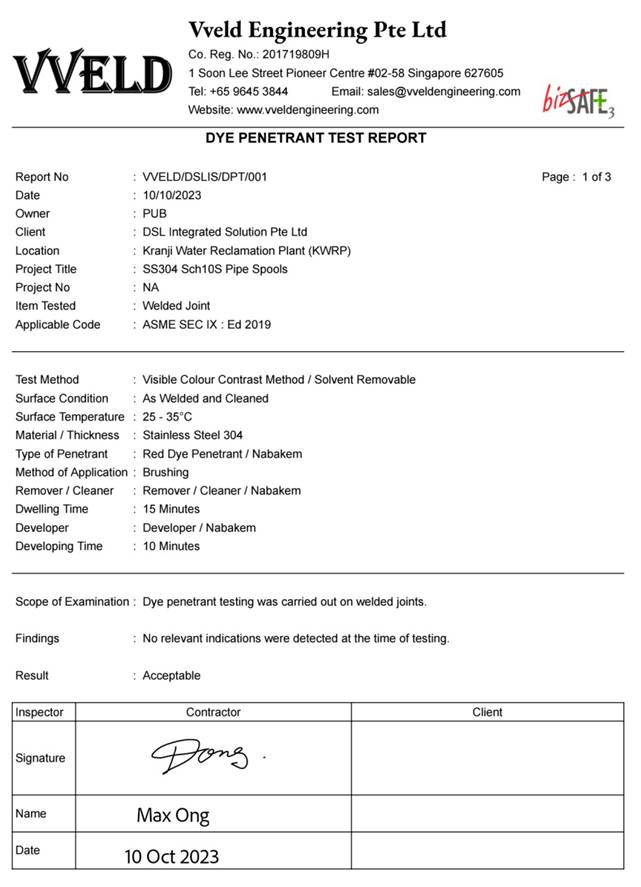
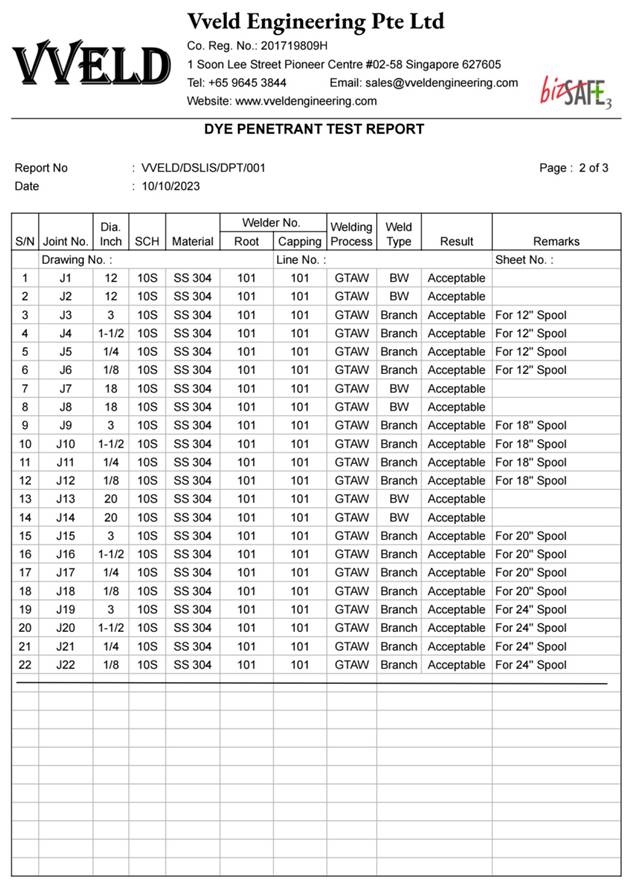
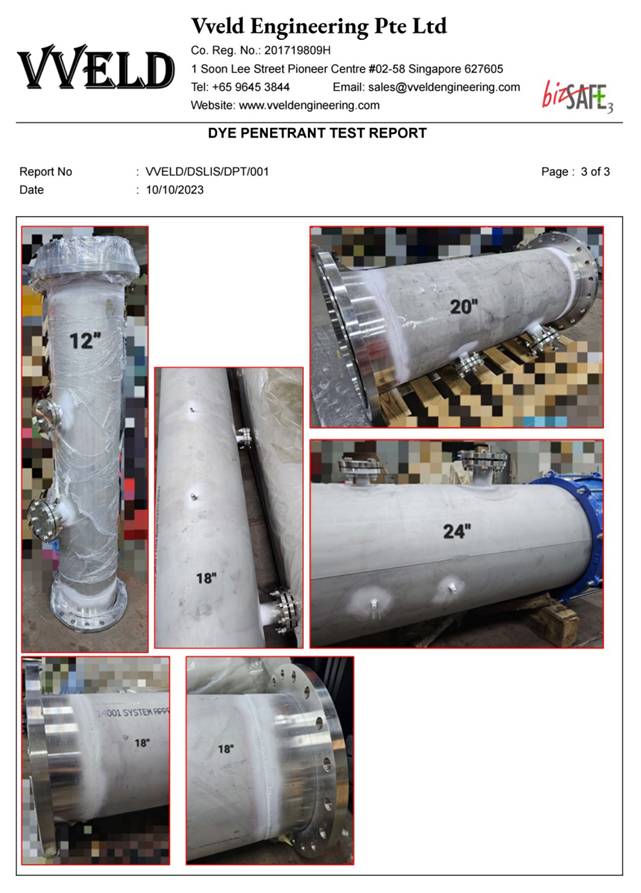
Equipment Datasheet:
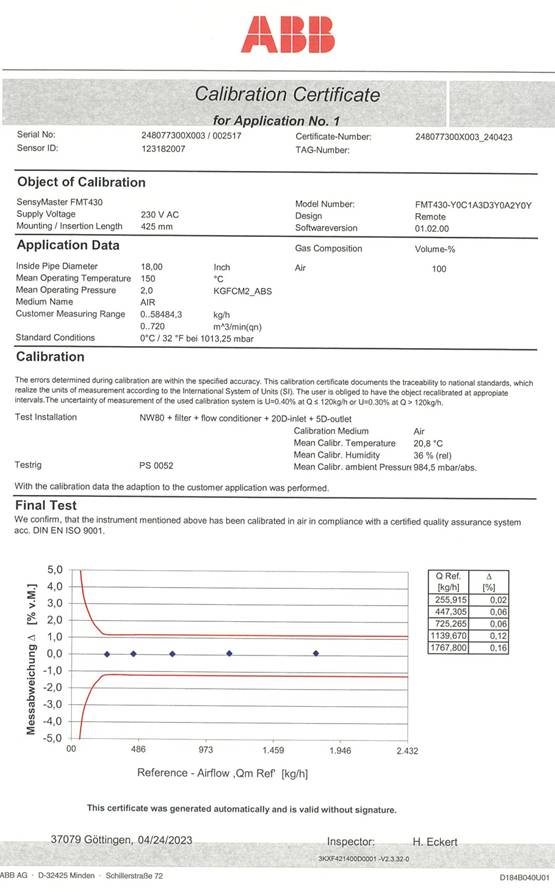
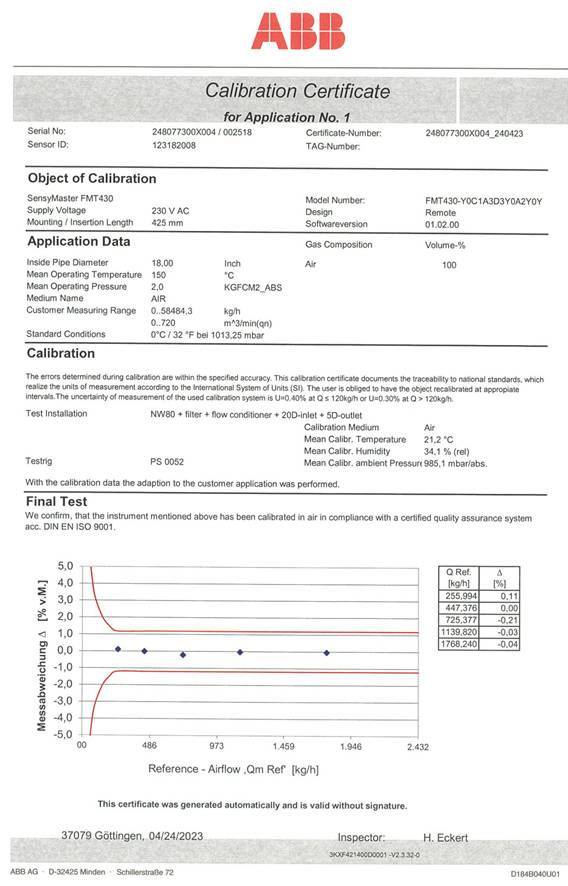
ABB Air Flowmeter Model FMT-430
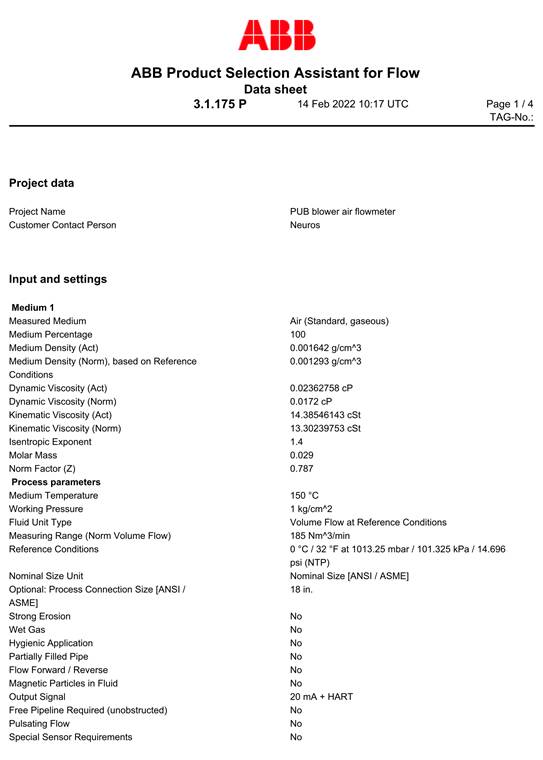
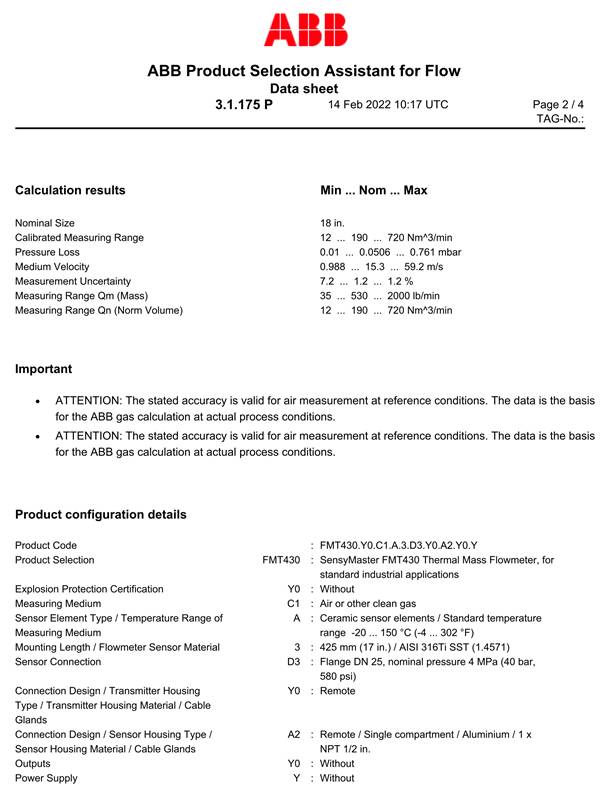
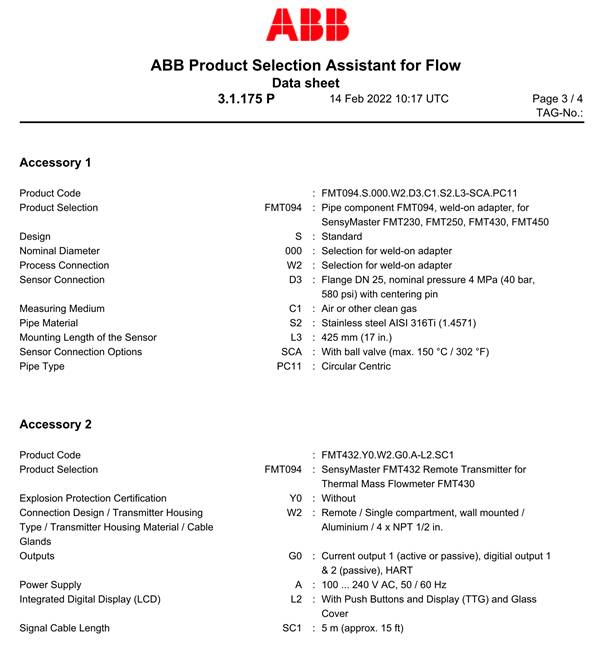
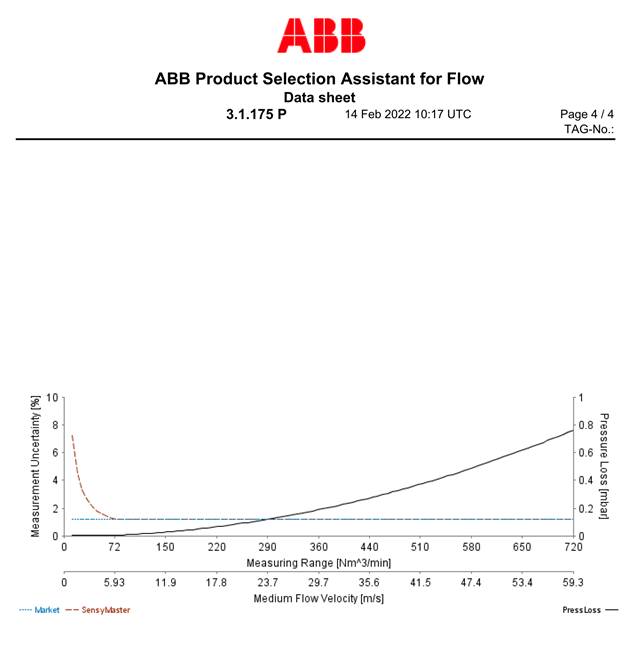
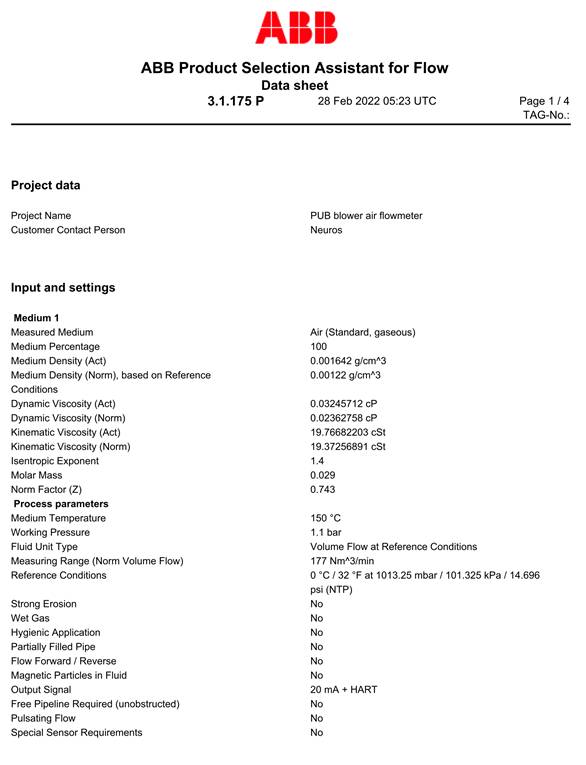
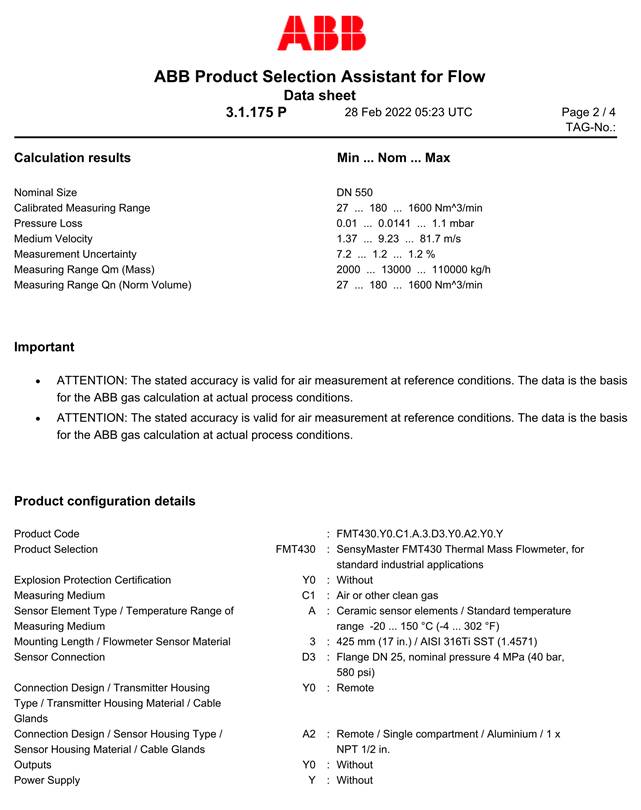
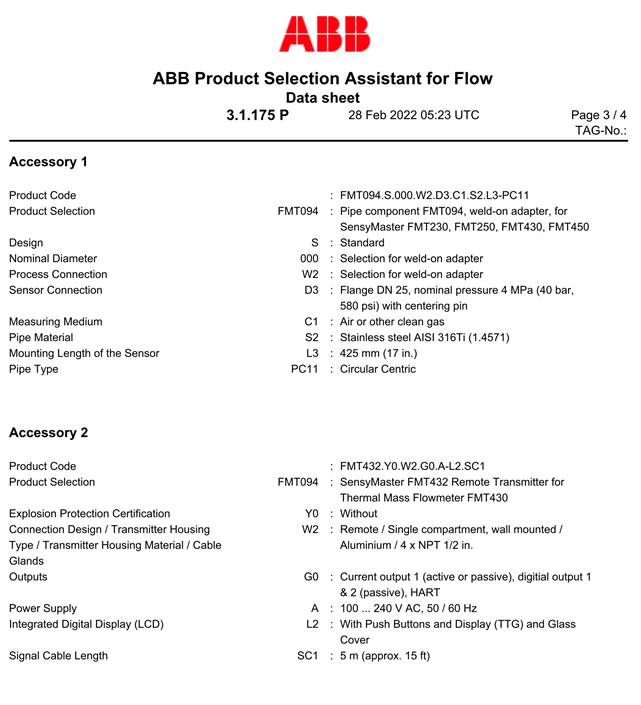
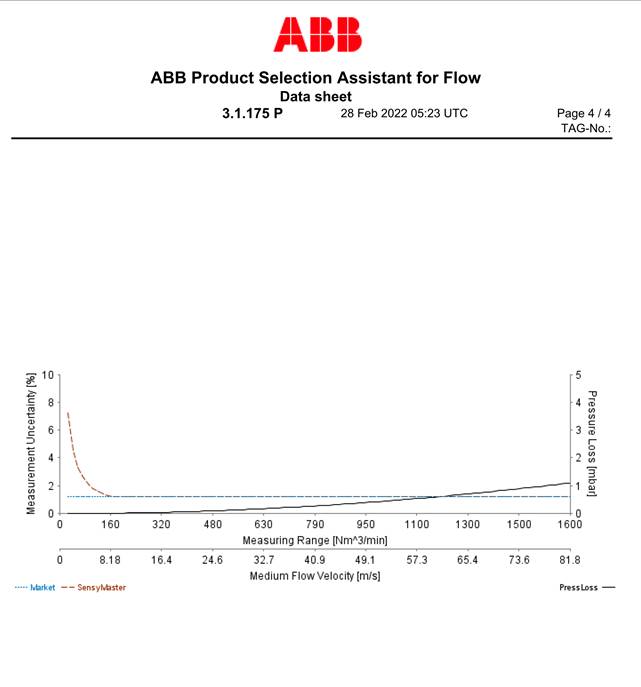
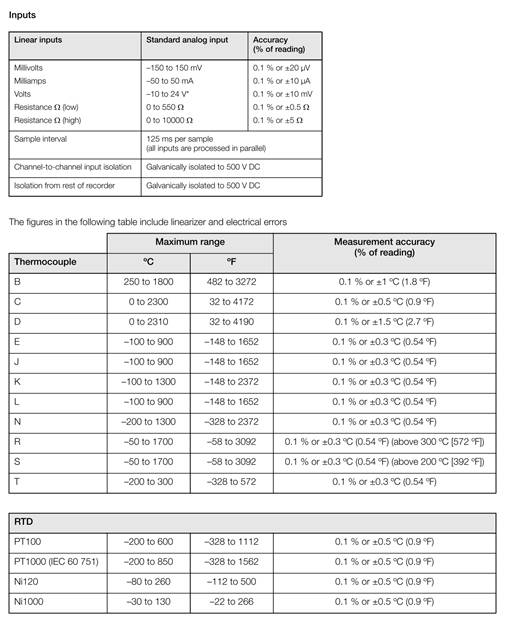
ABB Datalogger: ScreenMaster RVG2000

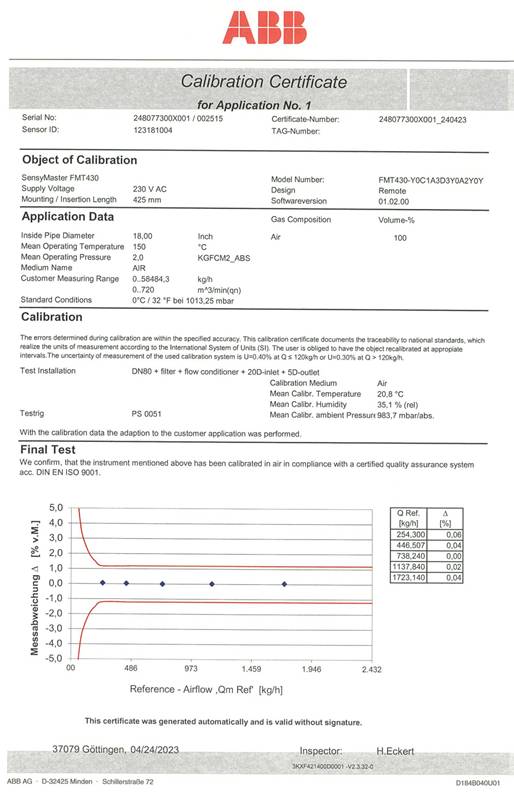
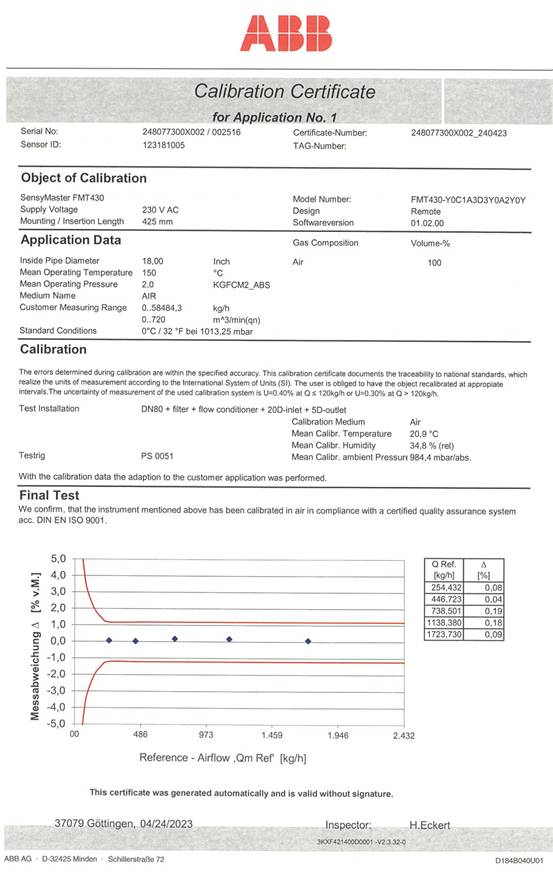
Calibration Certificate:
ABB Air Flowmeter Model FMT-430
Equipment Datasheet:
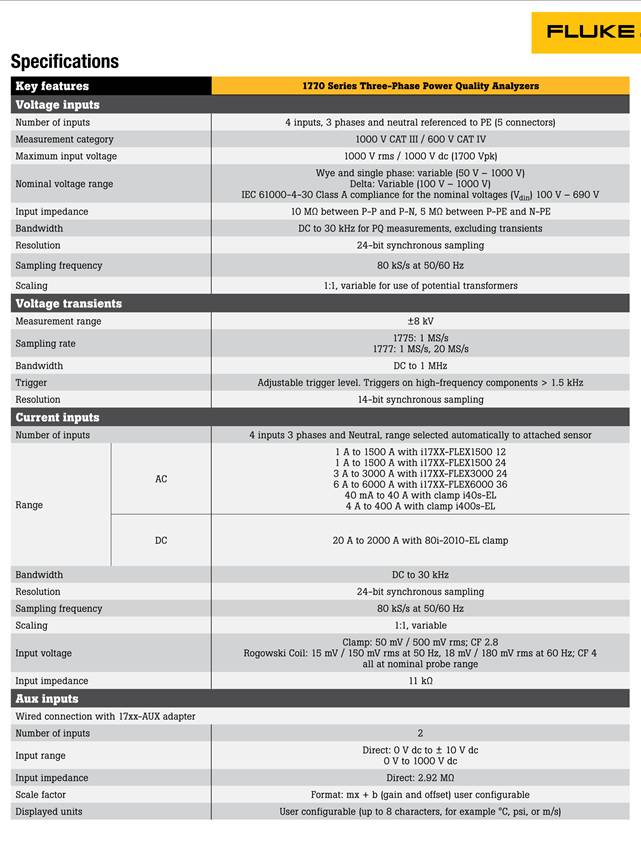
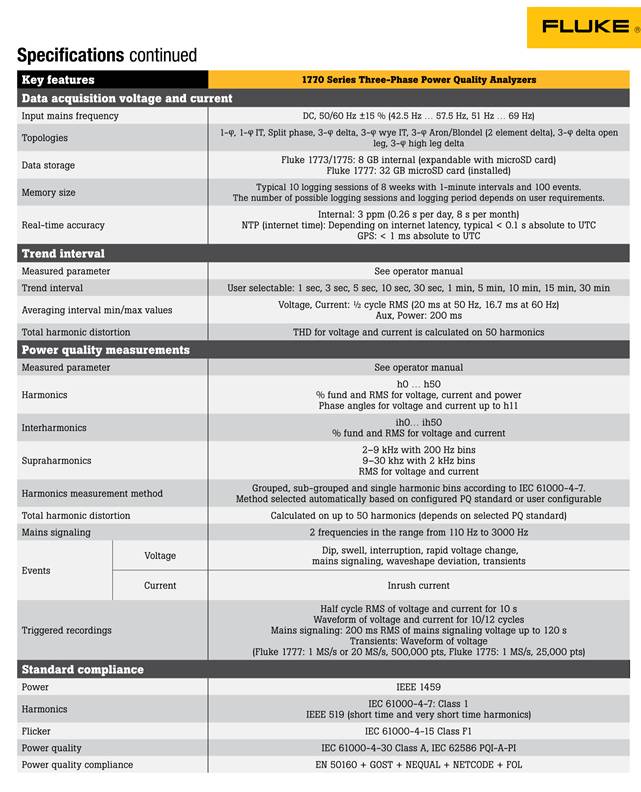
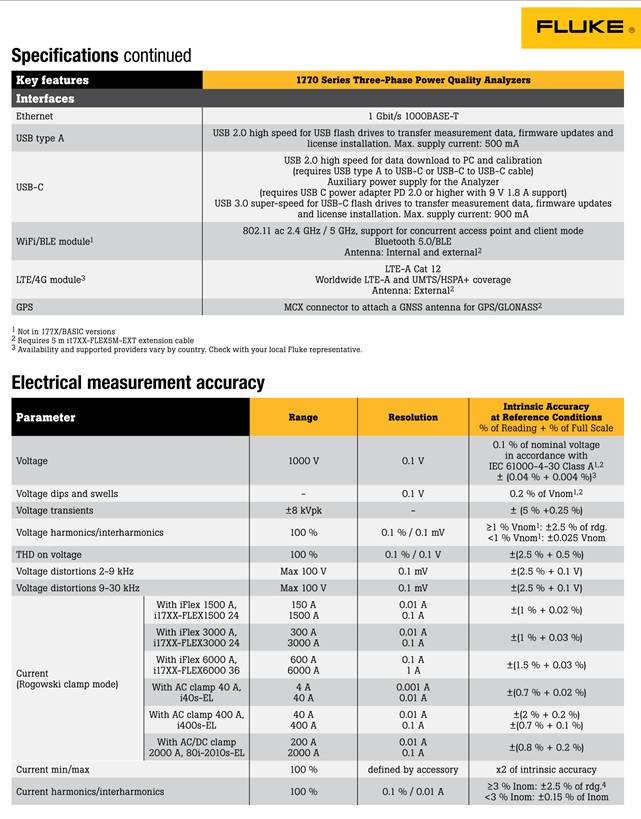
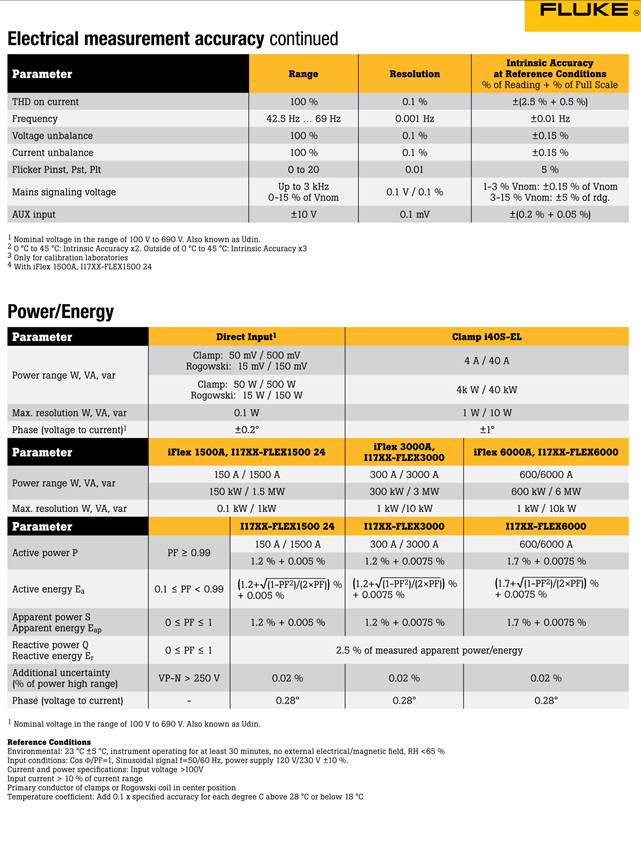
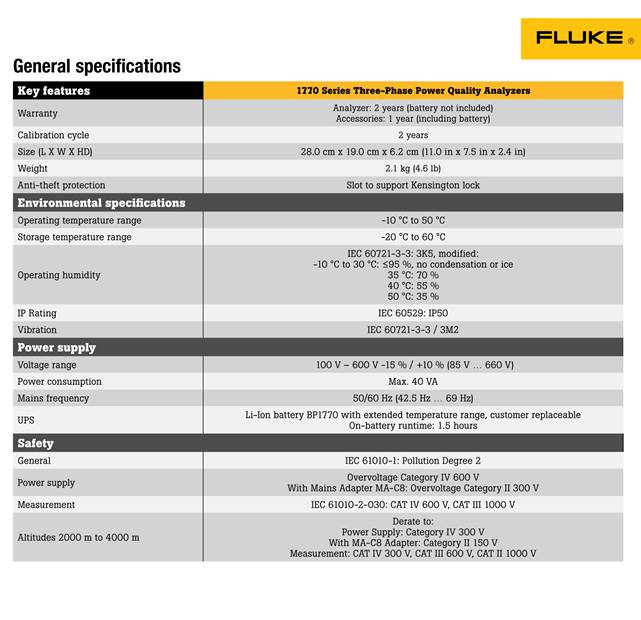
Fluke Model 1777 Power Quality Analyzer

Procedure & Methodology:
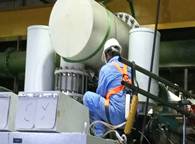
1. Prior to installation of testing pipes, the blower to be tested is stopped from running. Lock Out Tag Out Procedures were applied for safe working environment and insulation jacketing for the discharge silencer and suction pipe spool were removed.
2. Removal of discharge silencer and in its place, the discharge testing pipe was fitted. Bolted connections were securely fastened.
3. Removal of suction pipe spool and in its place, the suction testing pipe was fitted. Bolted connections were securely fastened.
4. Installation of ABB FMT-430 Flow Transmitters into the designated nozzle sleeves welded on to the discharge and suction pipes. All bolted connections were securely fastened, During this process, visual verification was also done to check that probe orientation is aligned with the expected air flow direction.
5. Installation of WIKA analogue pressure gauge to both the discharge and suction testing pipes.
6. Screened instrument cables were run to connect the flow transmitters on the discharge and suction test pipes to the flowmeters installed on the measurement panel.
7. Connection of Fluke 1777 Power Quality Analyzer to the 3-phase output of the blower s Variable Frequency Drive (VFD).
8. After verification that all related instruments were connected, power was supplied to the measurement panel and the power quality analyzer.
9. Both cores of the blower were then started, one core followed the next core.
10. Recording function of the Power Quality Analyzer and the Flow measurement panel s datalogger was then activated. Data recorded from both sources was automatically archived on to the USB drives as trending continues.
11. Periodically, each day, photographs were also taken of the discharge and suction pressure and temperature readings. These readings were taken upon reaching stabilized condition after blower startup.
12. Data trending and recording was done over a period of at least 3 working days.
13. After completion over trending period, the USB drives were removed and the trending data downloaded on to Neuros Server for further analysis.
Theory of Operation:
1. The Neuros Turbo Blowers are designed to be a reactive equipment which varies the motor rotation speed (N, in rpm) in accordance to the Discharge Pressure and Temperature as derived from the internal sensors.
2. This feedback mechanism is regulated by the Variable Frequency Drive (VFD), governed by the parameters programmed into the Blower s Logic (PLC or Airfoil Bearing Controller).
3. During Factory Acceptance Test, the impeller curve as below shows design static pressure at target flowrate.
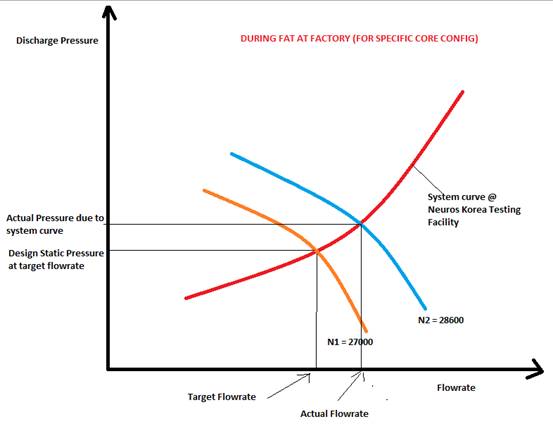
4. In addition, factory D1 derived impeller curves N1, N2, N3, etc, by varying upstream static pressure, thus getting the empirical value of flowrate (Q) for each rpm value (N).
5. This is the actual operating point giving actual flowrate at Factory D1.
6. This curve generated have been encoded into the PLC program from SY Park as reference operating curves at fixed pressures and fixed N, there will be a fixed flowrate value evaluated.
7. It is important to note that when the blower is installed at site, the system curve of the plant will be different than when tested at Factory.
8. The actual system curve of the plant depends on the pressure drop values of all the components within the pipework and other aeration system equipment.
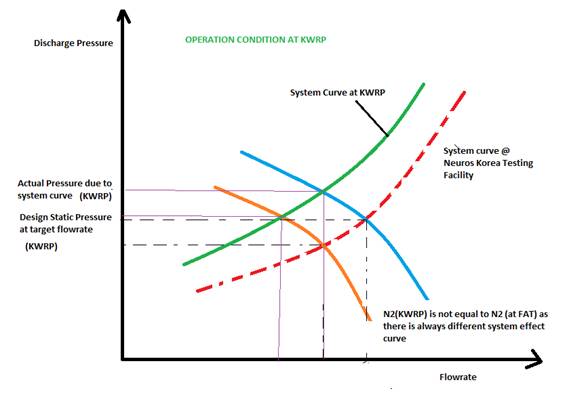
9. Above impeller curve illustrates the deviation of system curve from factory system curve as an example for illustration purpose only. In order to determine the actual system curve of the plant, a detailed study will need to be undertaken requiring controlled variation of upstream pressure. Such determination however will require manual changes to operation parameters of the aeration system overall, and hence may not be feasible in case of critical operation cycle which may be affected.
10. Typical efficiency figures are highly dependent on mostly impeller (aerodynamic) loss, while other losses are not as significant.
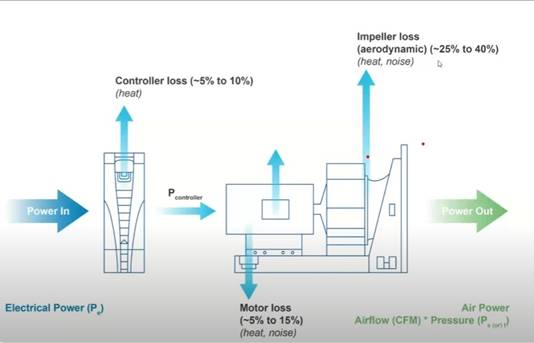
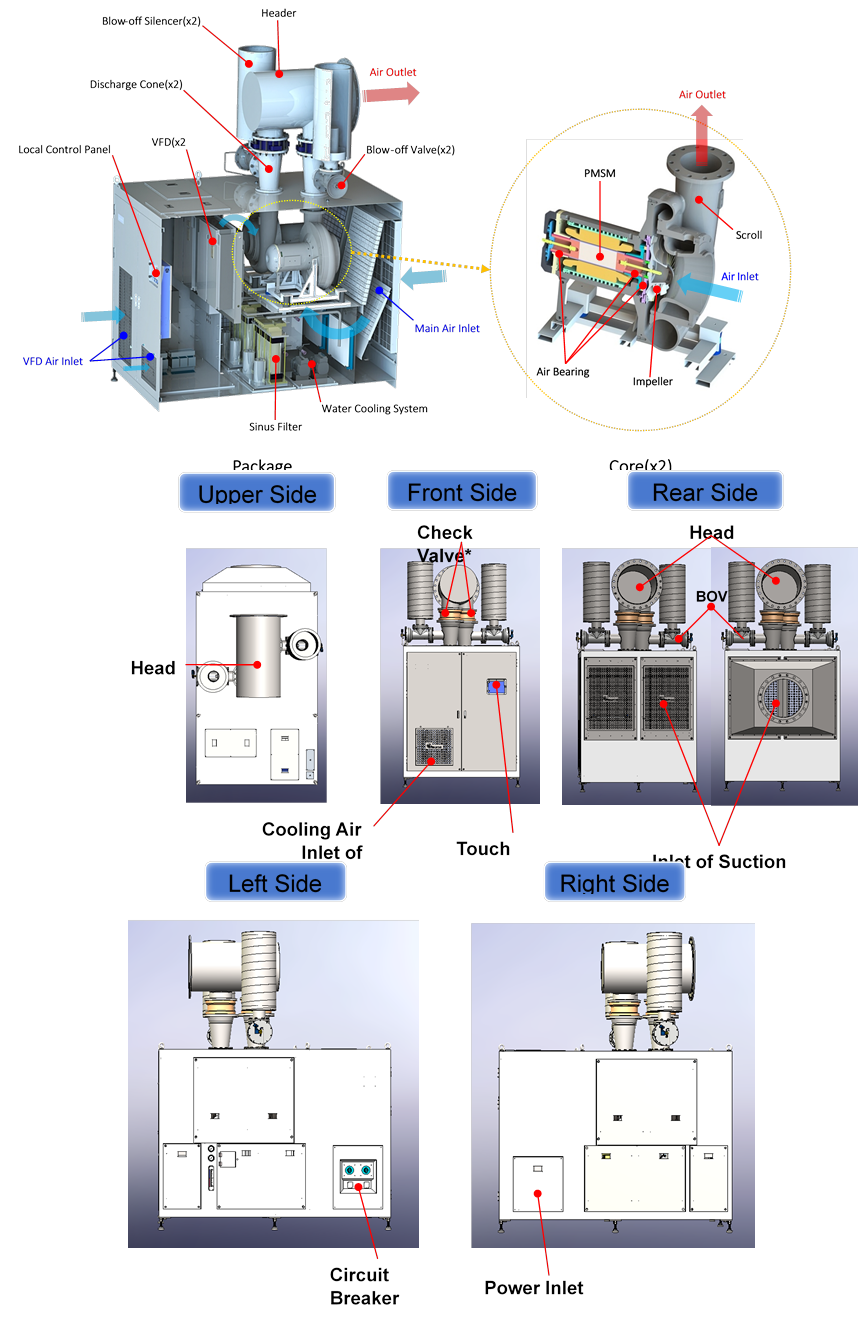
Basic Structure of Turbo Blowers (C110 and C060):
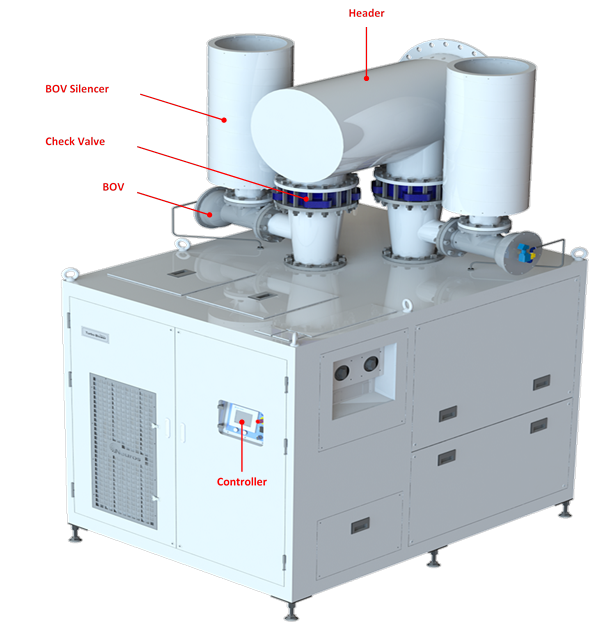 |
Basic Structure of Turbo Blowers (C110 and C060):
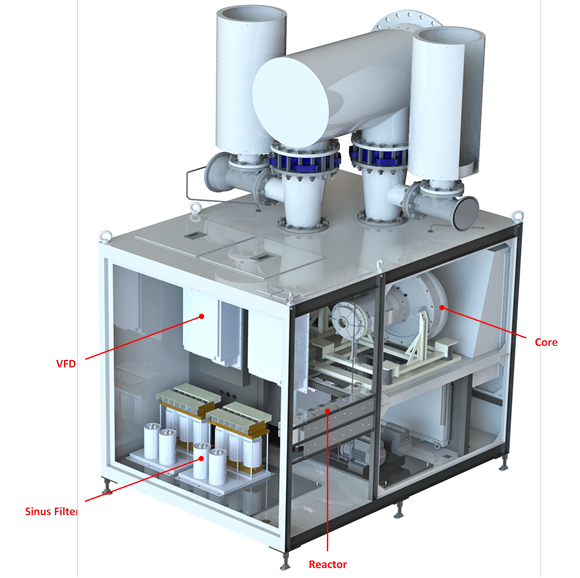 |
|||
 |
|||
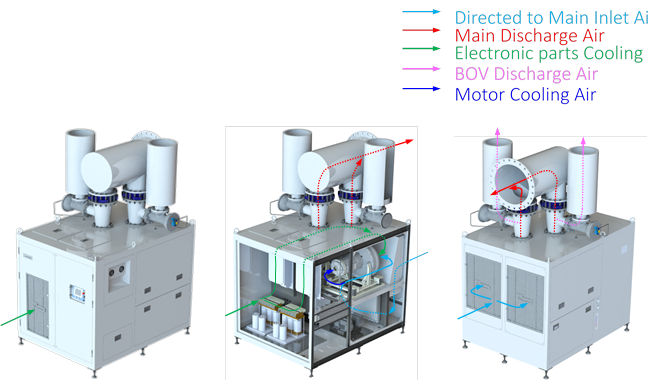
Air Flow Path
 |
Findings:
1. Phase 1 & 2 (OPH) Blowers
a. In general, it was found that actual discharge pressure for all six blowers in Phase 1 & 2 (Old Power House) was much lower than atmospheric, ranging between 0.6-0.7 barg.
b. As a result of this, during operation run-time, the wire to air efficiency obtained ranged between 73% to 85%.
c. All six blowers installed at Old Power House is operating within impeller curve envelop that intersects with a system curve that is close to the system curve during FAT.
d. Discharge temperature measured by ABB sensor indicates that it is in relatively moderate and stable range (less than 100 C).
2. Phase 3 (MTM) Blowers
a. In general, it was found that actual discharge pressure for all six blowers in Phase 3 (Main Treatment Module) was in the range of 1.0-1.1 barg.
b. During operation run-time, the wire to air efficiency obtained ranged between 78% to 85%.
c. All six blowers installed at MTM is operating within impeller curve envelop that intersects with an actual system curve that is further from the system curve during FAT. System effect is much more pronounced as it is observed that discharge flowrate from ABB sensor is markedly higher compared to discharge flowrate calculated from PLC (read from HMI). On average this difference is 1.0 Nm3/s.
d. Discharge temperature measured by ABB sensor indicates that it is on average, 120 C -140 C.
Uses of Turbo Blowers in Aeration Systems:
Conclusions & Recommendations:
3. Phase 1 & 2 (OPH) Blowers
a. All blower s wire to air efficiency has met the requirement, exceeding the 70% benchmark.
b. All six blowers installed at Old Power House is operating within impeller curve envelop that intersects with a system curve that is close to the system curve during FAT.
c. Discharge temperature measured by ABB sensor indicates that it is in relatively moderate and stable range (less than 100 C). This is considered normal for the blower in operating mode.
4. Phase 3 (MTM) Blowers
a. All blower s wire to air efficiency has met the requirement, exceeding the 70% benchmark.
b. System effect plays a much greater role in the difference between the PLC calculated discharge air flowrate reading and the actual discharge airflow rate reading. In addition, the higher discharge pressure in the common header has triggered the blower to ramp up the RPM to deliver a higher flowrate to overcome the higher downstream pressure in the discharge common header.
c. Although discharge temperature measured by ABB sensor indicates that it is in relatively high range, it is still within the design operating temperature of the NX400 blower. To prolong the lifetime of the blower, it is recommended to install heat dissipation devices such as Neuros Water Cooled Heat Exchanger device inside the blower core in order to reduce water vapour condensation inside blower check valve and the discharge common header line.
d. It is also recommended to install sine filters for all Phase 3 blowers. This is to ensure every electrical component is sized to match the capacity of the upgraded cores of the Phase 3 blowers.